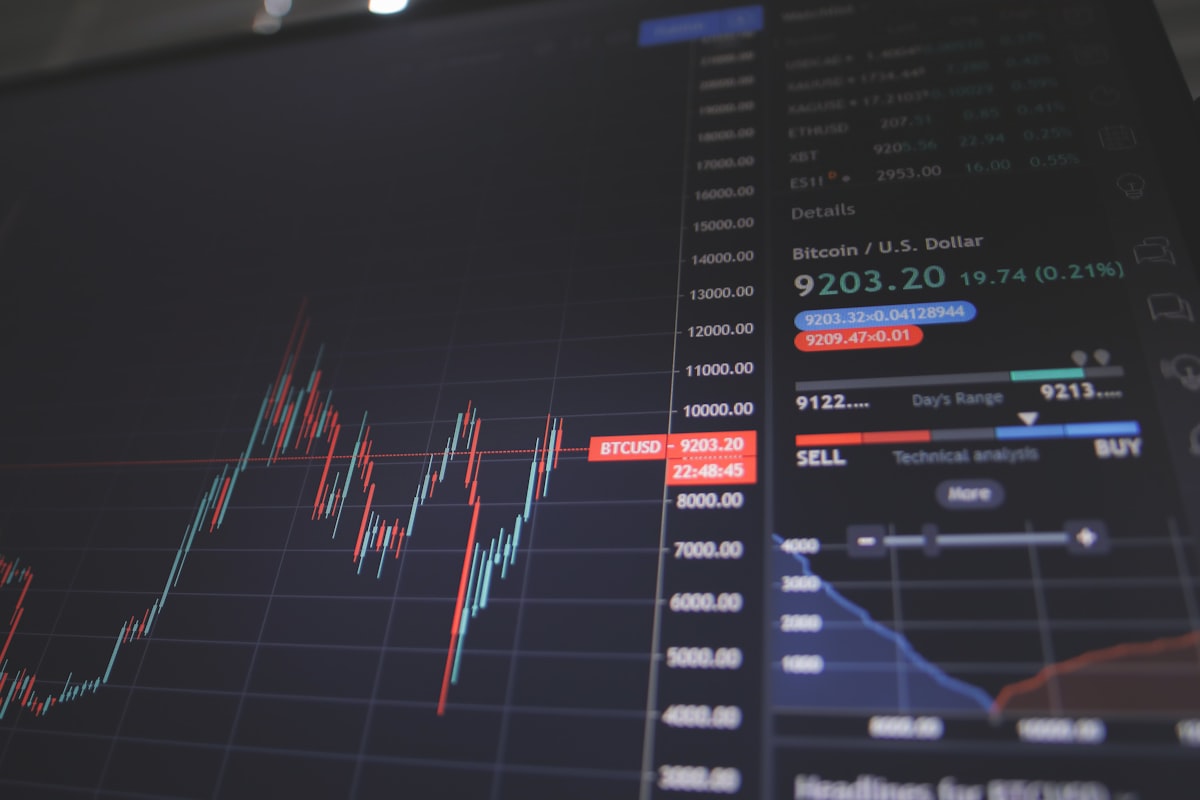
Technical analysis is a popular approach to analyzing and forecasting price movements in the crypto market. One way to do this is by using technical indicators, which are mathematical calculations based on price, volume, or other market data. These indicators can help traders identify trends, gauge market sentiment, and make informed trading decisions.
- Moving averages: Moving averages are a simple but powerful technical indicator that smooth out price data over a specific time period, making it easier to identify trends and trend reversals. There are different types of moving averages, including simple moving averages (SMAs), exponential moving averages (EMAs), and weighted moving averages (WMAs).
SMAs are calculated by adding up the closing prices of a security over a certain number of periods and then dividing the result by the number of periods. EMAs give more weight to recent price data, while WMAs give more weight to the middle of the data set.
Crypto traders often use moving averages to identify the overall trend of a particular asset and to identify potential support and resistance levels. For example, if the price of an asset is consistently above its 200-day moving average, it may be considered in an uptrend. On the other hand, if the price falls below its 200-day moving average, it may be considered in a downtrend.
2. Bollinger bands can help identify overbought or oversold conditions, as well as potential breakouts. For example, if the price of an asset is consistently touching the upper band, it may be considered overbought and could be ripe for a sell-off. On the other hand, if the price is consistently touching the lower band, it may be considered oversold and could be a good candidate for a long position.
Bollinger bands can help identify overbought or oversold conditions, as well as potential breakouts. For example, if the price of an asset is consistently touching the upper band, it may be considered overbought and could be ripe for a sell-off. On the other hand, if the price is consistently touching the lower band, it may be considered oversold and could be a good candidate for a long position.
3. Relative strength index (RSI): The relative strength index (RSI) is a momentum indicator that compares the magnitude of recent gains to recent losses to determine whether an asset is overbought or oversold. It is typically plotted on a scale of 0 to 100, with readings above 70 indicating an overbought condition and readings below 30 indicating an oversold condition.
Crypto traders often use the RSI to identify potential trend reversals. For example, if the RSI is consistently above 70 and then starts to decline, it may be a sign that the uptrend is losing momentum and could be reversing. On the other hand, if the RSI is consistently below 30 and then starts to rise, it may be a sign that the downtrend is losing momentum and could be reversing.
It's important to note that no single indicator is a magic bullet, and it's best to use a combination of indicators in conjunction with other technical and fundamental analysis tools. It's also important to backtest any trading strategies using historical data to ensure their effectiveness before applying them in live trading.